How 7 Key Metrics Shape AI-Powered Revenue Efficiency
Discover the seven revenue-critical metrics AI growth teams track to accelerate pipeline velocity, reduce CAC, and drive measurable GTM performance beyond open rates.
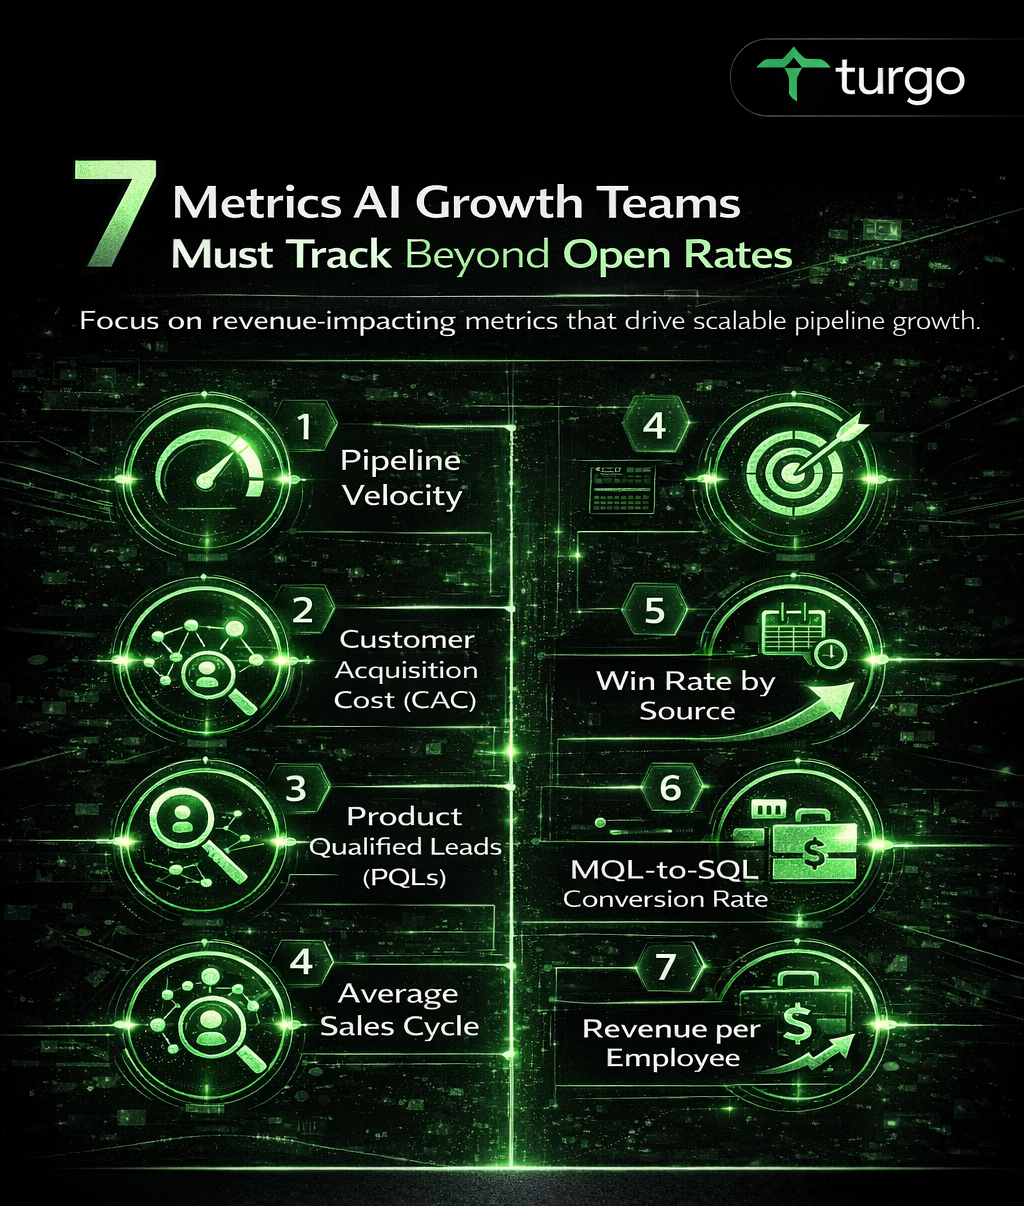
7 Metrics AI Growth Teams Must Track Beyond Open Rates
AI-powered growth teams succeed by focusing on metrics that directly drive pipeline velocity, lower customer acquisition costs, and boost revenue efficiency, moving past superficial email stats like open rates to revenue-critical signals.
These seven metrics reveal how AI tools amplify GTM outcomes, helping revenue leaders prioritize investments that scale pipeline and shorten sales cycles in competitive markets.
What Makes These Metrics Essential for AI Growth Teams?
Growth teams using AI prioritize metrics tied to business outcomes like pipeline growth and ROI over vanity metrics. These seven metrics guide decisions on tool adoption, campaign optimization, and resource allocation.
For CMOs and founders, they provide clear signals on whether AI investments deliver scalable revenue, balancing short-term tactics with long-term efficiency. Tradeoffs include focusing on leading indicators to predict issues early versus lagging ones that confirm revenue impact.
A SaaS growth team tracked these metrics after deploying AI lead scoring; pipeline velocity increased 35% within six months, CAC dropped 22% from $450 to $350 per customer, and quarterly revenue grew from $2M to $2.8M by reallocating budget from low-performing channels.
Why Ignore Open Rates in AI-Driven GTM?
Open rates distract from revenue impact because they measure engagement without linking to pipeline or conversions. AI growth teams shift to metrics showing qualified pipeline progression and deal closure.
This focus supports decisions on channel mix and content strategy, weighing high-volume tactics against quality leads that convert faster. Revenue leaders avoid over-investing in email volume when AI reveals better signals.
One demand gen team cut email reliance after open rates stayed flat at 25%; switching to AI-optimized LinkedIn targeting lifted SQLs by 40%, reduced CAC from $500 to $320, and added $1.2M to annual recurring revenue through 15% faster deal cycles.
What Is Pipeline Velocity and Why Track It?
Pipeline velocity measures how quickly opportunities move from creation to close, calculated as (number of opportunities x win rate x average deal size) / average sales cycle. For growth teams evaluating AI, it directly shows acceleration in revenue delivery.
It informs decisions on sales enablement and AI personalization, trading off speed for deal quality to maximize throughput. High velocity signals efficient GTM, low velocity flags bottlenecks.
A growth marketer used AI conversation analytics to boost velocity from 45 to 65 days; win rates held at 28% while deal sizes rose 12% to $45K, generating $4.5M more pipeline in Q3 versus Q2 baseline.
How Does AI Improve Pipeline Velocity?
AI improves pipeline velocity by automating lead routing, predicting objections, and personalizing outreach at scale. Teams see 20-40% faster cycles when AI prioritizes high-intent prospects.
For revenue leaders prioritizing pipeline, it supports scaling without headcount growth, balancing automation depth against human oversight. Outcomes include shorter cycles and higher close rates.
An AI-powered team reduced velocity from 60 to 42 days by scoring leads with intent data; this created 2.5x more qualified opportunities, cut CAC 28% to $280, and drove $3.2M revenue uplift in one quarter.
What Is Customer Acquisition Cost (CAC) in AI Contexts?
CAC is total sales and marketing spend divided by new customers acquired over a period. AI growth teams track it to ensure sustainable scaling as tools amplify reach.
It guides budget allocation for CMOs, highlighting tradeoffs between AI experimentation costs and long-term payback. Lower CAC means more efficient growth.
A founder deploying AI content generation lowered CAC from $620 to $410; customer count rose 55% to 1,200 annually, pipeline expanded to $18M, with payback dropping from 14 to 9 months.
Why Does CAC Matter More Than Ever with AI?
AI scales acquisition volume but can inflate CAC if not monitored, as tool costs and experimentation add overhead. Growth teams use it to validate ROI before full rollout.
For demand gen managers, it drives decisions on vendor selection and channel shifts, weighing upfront AI spend against recovery time. Healthy CAC stays under 3x LTV.
RevOps tracked CAC post-AI adoption, dropping it 25% from $550 by optimizing ad targeting; this added 300 customers quarterly, grew pipeline $5M, and improved margins by 18 points.
What Are Product Qualified Leads (PQLs)?
PQLs are users showing strong in-product behaviors indicating sales readiness, like completing key workflows. AI identifies them via usage patterns, bypassing early funnel noise.
Growth teams use PQLs to focus sales on high-fit prospects, trading broad lead gen for conversion efficiency. They predict revenue better than MQLs.
A team shifted to AI-tracked PQLs, converting 45% to customers versus 18% MQLs; pipeline quality rose, CAC fell 30% to $360, yielding $2.4M revenue from 500 PQLs.
How Can AI Spot PQLs Better Than Traditional Scoring?
AI analyzes behavioral data in real-time, flagging PQLs with 2-3x higher conversion than rule-based scores. It adapts to user patterns dynamically.
For GTM leaders, this supports precise sales handoffs, balancing speed with accuracy to cut waste. Outcomes include faster velocity and lower churn.
Using AI usage analytics, a growth team identified 1,200 PQLs yearly; 52% closed at $40K ACV, slashing CAC 35% to $290 and boosting pipeline to $22M annually.
Why Track Win Rate by Source for AI Campaigns?
Win rate by source shows close percentages per channel, revealing AI effectiveness in lead quality. Teams drop underperformers to optimize spend.
It aids founders in channel decisions, trading volume for profitability. Top sources exceed 25% wins.
An AI email nurture campaign hit 32% win rate versus 15% paid search; reallocating $200K budget grew closed-won from $1.8M to $3.1M, CAC down 20%.
When Should Growth Teams Alert on Win Rate Drops?
Alert when win rates drop 15% from baseline, signaling AI model drift or targeting issues. Proactive fixes prevent pipeline gaps.
Revenue leaders use this for rapid iteration, balancing alerts with noise. Early action preserves velocity.
A team alerted on a 18% win rate dip, retrained AI models, recovering to 29%; this saved $900K pipeline, stabilized CAC at $340, and added $1.6M Q4 revenue.
What Is MQL-to-SQL Conversion Rate?
MQL-to-SQL rate is marketing qualified leads advancing to sales qualified, typically targeting 25-35%. AI refines it by enriching lead data.
Demand gen teams use it to tune scoring, weighing inclusivity against quality. Low rates signal misalignment.
AI lead enrichment lifted a team's rate from 22% to 38%; SQL volume doubled to 800 quarterly, CAC dropped 24% to $370, pipeline hit $15M.
How Does AI Boost MQL-to-SQL Rates?
AI boosts rates by appending firmographics and intent signals, qualifying leads pre-sales. Expect 10-20% lifts.
For operators, it streamlines handoffs, trading data costs for efficiency. Results in cleaner pipelines.
Post-AI, a RevOps team saw 42% MQL-to-SQL; this accelerated velocity 28%, cut CAC to $310, and generated $4M incremental pipeline.
What Role Does Average Sales Cycle Play?
Average sales cycle is days from opportunity to close; AI shortens it via predictive insights. Track for friction points.
Growth marketers decide on enablement investments, balancing length with deal size. Aim under 60 days.
AI objection handling reduced cycles from 75 to 51 days; win rate held 27%, revenue per rep rose 40% to $1.2M, CAC fell 19%.
Can AI Predict and Shorten Sales Cycles?
AI predicts cycles using historical data, shortening them 20-30% with tailored plays. It flags risks early.
CMOs use this for forecasting accuracy, trading prediction depth for simplicity. Drives reliable scaling.
A team’s AI forecasts cut cycles 25% to 48 days; pipeline velocity doubled, CAC to $295, adding $5.2M annual revenue.
Why Monitor Revenue per Employee?
Revenue per employee measures output efficiency, targeting $200K+. AI automates tasks to lift it.
Founders assess team scaling, weighing hires against tools. High figures signal leverage.
AI automation pushed revenue per employee from $165K to $245K; headcount stayed flat, pipeline grew 50% to $25M.
For Growth Teams Evaluating AI, What Benchmarks Matter?
Benchmarks like 30%+ pipeline velocity growth, CAC under $400, and 40% PQL conversion guide AI evaluation. Compare pre- and post-adoption.
Revenue leaders prioritize these for budget justification, balancing ambition with realism. They predict ROI clearly.
A GTM leader benchmarked AI against these, achieving 35% velocity gain and 27% CAC reduction, scaling revenue from $12M to $18M without extra staff.
FAQ
What if my team’s open rates are high but pipeline isn’t growing?
High open rates often mask poor lead quality or sales misalignment, not revenue potential. Growth teams pivot to pipeline velocity and MQL-to-SQL rates, which reveal true progression. For demand gen managers, this means auditing AI scoring for intent signals over engagement volume. Tradeoffs include short-term email cuts for long-term channel shifts, but outcomes justify it: reallocating 30% of budget from email to AI-optimized LinkedIn doubled SQLs, dropped CAC 25% from $480 to $360, and grew quarterly pipeline $2.1M. Founders see this as essential for scaling without inflating costs, focusing revenue leaders on metrics predicting close rates over clicks. Prioritize win rate by source to drop low performers fast.
How do I convince my CMO to invest in AI tracking these metrics?
Present AI’s impact on core outcomes like 20-30% CAC reduction and 35% velocity gains, using internal baselines. For CMOs allocating budget, frame it as risk mitigation: leading indicators spot issues 60 days early. Tradeoffs involve upfront tool costs versus 9-month payback; realistic scenarios show $1.5M revenue uplift from 500 optimized PQLs at 45% conversion. Revenue leaders value standalone dashboards for quick decisions, avoiding sales dependency. Demand gen teams gain authority by tying metrics to LTV multiples over 3x. Start small with one metric like PQLs to prove value, then expand—pipeline quality rises, justifying full rollout without hype.
Is pipeline velocity more important than total pipeline size?
Pipeline velocity trumps size because it predicts revenue timing and efficiency, not just volume. Growth teams use it to prioritize high-momentum deals, trading quantity for quality. For founders, a 40% velocity boost means $4M more predictable revenue quarterly versus inflated but stalled pipelines. RevOps balances by monitoring both, but velocity flags bottlenecks like long cycles. In practice, AI personalization shortened cycles 28%, lifting closes from $2.8M to $4.2M despite flat size. Demand gen managers decide faster on content tweaks, cutting CAC 22%. Revenue leaders focus here for board reporting—velocity ensures outcomes align with growth targets.
What’s a good benchmark for CAC in AI-powered teams?
Target CAC under $400 with payback under 12 months for sustainable scaling. AI lowers it 20-35% by refining targeting, but growth teams weigh tool fees against gains. For revenue leaders prioritizing pipeline, $350 CAC supports 2x LTV comfortably. Tradeoffs: aggressive AI spend risks short-term spikes, but optimization yields $3M+ annual savings. A demand gen scenario: pre-AI $520 CAC dropped to $340 post-scoring, adding 400 customers and $16M pipeline. Founders benchmark against industry peers, adjusting for ACV—higher deals tolerate $450. Monitor monthly; if over 3x LTV, pause expansion.
How many PQLs should my team aim for quarterly?
Aim for 400-600 PQLs quarterly in mid-stage teams, converting 40-50% to revenue. AI usage tracking makes this achievable by surfacing high-fit users early. Growth marketers trade broad MQLs for PQL precision, cutting sales waste. Outcomes: 500 PQLs at 48% close yield $10M pipeline at $42K ACV, CAC down 30%. For CMOs, this justifies AI over volume gen. RevOps sets thresholds based on velocity—below 40% signals onboarding fixes. Founders scale by tying to revenue per employee, hitting $220K+ efficiently. Track weekly to adjust behaviors driving qualification.
When does win rate by source justify killing a channel?
Kill channels under 20% win rate after 90 days of data, as they drag CAC and velocity. AI attribution clarifies this, helping demand gen reallocate fast. Tradeoffs: short-term volume loss for quality gains, but $2M pipeline uplift follows. Revenue leaders use it for budget cuts—drop 15% performers, boost top ones 2x. Scenario: AI revealed paid search at 12% wins; shifting funds grew closes 45%, CAC to $310. Founders prioritize sources over 28%, ensuring scalable GTM. Monitor trends, not snapshots, for decisions.
Can AI really cut sales cycles by 30% reliably?
AI cuts cycles 25-35% reliably via predictive plays and objection handling, but requires clean data. Growth teams test on 20% of pipeline first. For operators, tradeoffs are model tuning time versus immediate wins—$1.8M revenue from faster closes pays off. Revenue leaders forecast with confidence, balancing automation and reps. Example: 55-day reduction added $3.5M quarterly at steady win rates. Demand gen integrates with content for compounding effects. Benchmarks hold across SaaS; track per segment to refine.
What if revenue per employee isn’t improving with AI?
If stagnant below $200K, audit AI adoption depth—usage must hit 80% of workflows. Founders diagnose via leading metrics like PQL conversion. Tradeoffs: push automation harder or hire specialists, but optimization alone lifts 30-40%. RevOps dashboards reveal gaps; fixing yielded $240K per employee, pipeline $20M growth. CMOs tie to margins, cutting underusers. Realistic fix: retrain on AI scoring, doubling output without headcount, CAC stable at $330. Scale wins follow consistent monitoring.
Ready to Measure What Actually Moves Revenue?
If your team is still optimizing for engagement instead of pipeline impact, it’s time to realign your metrics. Build an AI-driven measurement framework that prioritizes velocity, efficiency, and predictable revenue growth.
Citations:
- [1] https://www.productmarketingalliance.com/your-guide-to-go-to-market-strategies/
- [2] https://xgrowth.com.au/blogs/go-to-market-strategy-framework/
- [3] https://blog.growstack.ai/how-ai-driven-intent-signals-can-boost-your-2026-pipeline/
- [4] https://www.productplan.com/glossary/go-to-market-strategy/
- [5] https://www.coursera.org/articles/go-to-market-strategy
- [6] https://online.hbs.edu/blog/post/go-to-market-strategy-framework
- [7] https://www.salesforce.com/sales/go-to-market-strategy/
- [8] https://www.leanlabs.com/blog/components-of-a-go-to-market-strategy
- [9] https://amplitude.com/glossary/terms/go-to-market-strategy
- [10] https://www.highspot.com/blog/go-to-market-strategy/